Overview-Climate Change: Difference between revisions
No edit summary |
No edit summary |
||
| Line 7: | Line 7: | ||
<gallery> | <gallery> | ||
File:Climate Crisis-William Hall.pdf|Link to Complete PDF Document | File:Climate Crisis-William Hall.pdf|Link to Complete PDF Document | ||
File:Climate Crisis-William Hall Image 1.png|Growth of World Population | |||
File:WEB-Figure-2-1-World-primary-energy-consumption.png| Graph of Energy Usage | File:WEB-Figure-2-1-World-primary-energy-consumption.png| Graph of Energy Usage | ||
File:Climate CrisisWilliam Hall Image3.jpg| Anthropogenic Radiative Forcing | File:Climate CrisisWilliam Hall Image3.jpg| Anthropogenic Radiative Forcing | ||
Revision as of 09:10, 29 October 2019


The Climate Crisis-William Hall
-
Link to Complete PDF Document
-
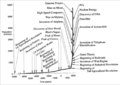
Growth of World Population
-
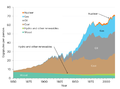
Graph of Energy Usage
-
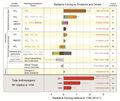
Anthropogenic Radiative Forcing


THE GLOBAL CLIMATE 2015–2019
Compared to the previous five-year assessment period 2011–2015, the current five-year eriod 2015–2019 has seen a continued increase in carbon dioxide (CO2 ) emissions and an accelerated increase in the atmospheric concentration of major greenhouse gases (GHGs), with growth rates nearly 20% higher. The increase in the oceanic CO2 concentration has increased the ocean’s acidity. The five-year period 2015–20191 is likely to be the warmest of any equivalent period on record globally, with a 1.1 °C global temperature increase since the pre-industrial period and a 0.2 °C increase compared to the previous five-year period.
Earth 4C Hotter
Because prominent scientists addressed the issue of a 4C planet and because climate scientists, in general, are constantly apologizing for being too conservative, too timid in their forecasts as actual climate change buries their predictions with a dagger to the heart, it is a worthwhile exercise to look at a 4C world. It could happen within current lifetimes just like the scientists speculated 10 years ago. But, of course, nobody knows for sure. After all, it helps to brace oneself ahead of time, just in case.
The Crazy Scale of Human Carbon Emission
Current data (from direct measurements of the atmosphere to historical records of industry) tells us that between 1751 and 1987 fossil fuels put about 737 billion tons of CO2 into the atmosphere. Between just 1987 and 2014 it was about the same mass: 743 billion tons. Total CO2 from industrialized humans in the past 263 years: 1,480 billion tons.
Major Study Rewrites the Driving Source of Atlantic Ocean Circulation
The OSNAP array revealed overturning circulation between the southwestern tip of Greenland and the Scottish shelf is about seven times greater than that in the Labrador Sea, the team reports today in the journal Science. Irregular overturning in the area east of Greenland also accounts for 88 percent of the variation in AMOC, the researchers found.
'No doubt left' about scientific consensus on global warming, say experts
The scientific consensus that humans are causing global warming is likely to have passed 99%, according to the lead author of the most authoritative study on the subject, and could rise further after separate research that clears up some of the remaining doubts.
Three studies published in Nature and Nature Geoscience use extensive historical data to show there has never been a period in the last 2,000 years when temperature changes have been as fast and extensive as in recent decades.
Last phase of the Little Ice Age forced by volcanic eruptions
During the first half of the nineteenth century, several large tropical volcanic eruptions occurred within less than three decades. The global climate effects of the 1815 Tambora eruption have been investigated, but those of an eruption in 1808 or 1809 whose source is unknown and the eruptions in the 1820s and 1830s have received less attention. Here we analyse the effect of the sequence of eruptions in observations, global three-dimensional climate field reconstructions and coupled climate model simu-lations. All the eruptions were followed by substantial drops of summer temperature over the Northern Hemisphere land areas. In addition to the direct radiative effect, which lasts 2–3 years, the simulated ocean–atmosphere heat exchange sustained cool-ing for several years after these eruptions, which affected the slow components of the climate system. Africa was hit by two decades of drought, global monsoons weakened and the tracks of low-pressure systems over the North Atlantic moved south. The low temperatures and increased precipitation in Europe triggered the last phase of the advance of Alpine glaciers. Only after the 1850s did the transition into the period of anthropogenic warming start. We conclude that the end of the Little Ice Age was marked by the recovery from a sequence of volcanic eruptions, which makes it difficult to define a single pre-industrial baseline.
No evidence for globally coherent warm and cold periods over the preindustrial Common Era
Earth’s climate history is often understood by breaking it down into constituent climatic epochs1. Over the Common Era (the past 2,000 years) these epochs, such as the Little Ice Age2–4, have been characterized as having occurred at the same time across extensive spatial scales5. Although the rapid global warming seen in observations over the past 150 years does show nearly global coherence6, the spatiotemporal coherence of climate epochs earlier in the Common Era has yet to be robustly tested. Here we use global palaeoclimate reconstructions for the past 2,000 years, and find no evidence for preindustrial globally coherent cold and warm epochs. In particular, we find that the coldest epoch of the last millennium—the putative Little Ice Age—is most likely to have experienced the coldest temperatures during the fifteenth century in the central and eastern Pacific Ocean, during the seventeenth century in northwestern Europe and southeastern North America, and during the mid-nineteenth century over most of the remaining regions. Furthermore, the spatial coherence that does exist over the preindustrial Common Era is consistent with the spatial coherence of stochastic climatic variability. This lack of spatiotemporal coherence indicates that preindustrial forcing was not sufficient to produce globally synchronous extreme temperatures at multidecadal and centennial timescales. By contrast, we find that the warmest period of the past two millennia occurred during the twentieth century for more than 98 per cent of the globe. This provides strong evidence that anthropogenic global warming is not only unparalleled in terms of absolute temperatures5, but also unprecedented in spatial consistency within the context of the past 2,000 years.
Consistent multidecadal variability in global temperature reconstructions and simulations over the Common Era
Multidecadal surface temperature changes may be forced by natural as well as anthropogenic factors, or arise unforced from the climate system. Distinguishing these factors is essential for estimating sensitivity to multiple climatic forcings and the amplitude of the unforced variability. Here we present 2,000-year-long global mean temperature reconstructions using seven different statistical methods that draw from a global collection of temperature-sensitive palaeoclimate records. Our recon-structions display synchronous multidecadal temperature fluctuations that are coherent with one another and with fully forced millennial model simulations from the Coupled Model Intercomparison Project Phase 5 across the Common Era. A substantial portion of pre-industrial (1300–1800 CE) variability at multidecadal timescales is attributed to volcanic aerosol forcing. Reconstructions and simulations qualitatively agree on the amplitude of the unforced global mean multidecadal temperature variability, thereby increasing confidence in future projections of climate change on these timescales. The largest warming trends at timescales of 20 years and longer occur during the second half of the twentieth century, highlighting the unusual character of the warming in recent decades.
CO2 Levels Just Hit Another Record—Here’s Why It Matters
There’s still some scientific uncertainty regarding exactly how much warming is associated with a given increase in atmospheric CO2. But scientists are able to calculate a broad range of likely outcomes. This has given rise to a concept known as the “carbon budget”—a scientific estimate of how much additional CO2 would cause the world to blow past its temperature targets.
Climate change:evidence from the Geological Record
Geological Society of London November 2010
The last century has seen a rapidly growing global
population and much more intensive use of resources, leading to greatly increased emissions of gases, such as carbon dioxide and methane, from the burning of fossil fuels (oil, gas and coal), and from agriculture, cement production and deforestation. Evidence from the geological record is consistent with the physics that shows that adding large amounts of carbon dioxide to the atmosphere warms the world and may lead to: higher sea levels and flooding of low-lying coasts; greatly changed patterns of rainfall; increased acidity of the oceans; and decreased oxygen levels in seawater.
Origins of Climate Change
Many people trace the origins of today’s climate crisis to the Industrial Revolution, when humans first began to burn large amounts of coal, but the crisis’s true roots extend further back to the onset of colonialism. When European colonizers ventured to Africa, Asia, North and South America, they invariably plundered the local natural resources, damaged habitats, hunted species to extinction, and often forced human inhabitants into slavery.
The chart that defines our warming world=
Is this the simplest way to show what is meant by global warming? The chart below organises all the countries of the world by region, time and temperature. The trend is unmistakeable.
One climate crisis disaster happening every week, UN warns
Catastrophes such as cyclones Idai and Kenneth in Mozambique and the drought afflicting India make headlines around the world. But large numbers of “lower impact events” that are causing death, displacement and suffering are occurring much faster than predicted, said Mami Mizutori, the UN secretary-general’s special representative on disaster risk reduction. “This is not about the future, this is about today.”
Scientists’ warning to humanity: microorganisms and climate change
In the Anthropocene, in which we now live, climate change is impacting most life on Earth. Microorganisms support the existence of all higher trophic life forms. To understand how humans and other life forms on Earth (including those we are yet to discover) can withstand anthropogenic climate change, it is vital to incorporate knowledge of the microbial ‘unseen majority’. We must learn not just how microorganisms affect climate change (including production and consumption of greenhouse gases) but also how they will be affected by climate change and other human activities. This Consensus Statement documents the central role and global importance of microorganisms in climate change biology. It also puts humanity on notice that the impact of climate change will depend heavily on responses of microorganisms, which are essential for achieving an environmentally sustainable future.
Scientists Issue Warning To Humanity: Climate Change Depends On Microbes
The world’s dirt holds on to some 2.2 trillion tons of carbon. That’s more than the combined amount of carbon in the atmosphere and in vegetation. And what controls how much carbon soil can hang on to and how much it releases? Microbes. Their carbon gatekeeping is critical, because the element is one of the key components of the greenhouse gas carbon dioxide (CO2), which is currently at record levels in Earth’s atmosphere.
The same is true of soil microbes. “In terrestrial environments, microbes release a range of important greenhouse gases to the atmosphere (carbon dioxide, methane and nitrous oxide), and climate change is causing these emissions to increase,” Cavicchioli said. That’s because, as with plants, hotter temperatures cause soil microbes to release more carbon. And since climate-change-induced warming is only getting worse, scientists expect more carbon from vegetation and soils will go into the atmosphere.
Leaving microbes out of climate change conversation has major consequences, experts warn
More than 30 microbiologists from 9 countries have issued a warning to humanity - they are calling for the world to stop ignoring an 'unseen majority' in Earth's biodiversity and ecosystem when addressing climate change.
For example, the Census of Marine Life estimates that 90% of the ocean's total biomass is microbial. In our oceans, marine lifeforms called phytoplankton take light energy from the sun and remove carbon dioxide from the atmosphere as much as plants. The tiny phytoplankton form the beginning of the ocean food web, feeding krill populations that then feed fish, sea birds and large mammals such as whales.
"Climate change also expands the number and geographic range of vectors (such as mosquitos) that carry pathogens. The end result is the increased spread of disease, and serious threats to global food supplies."
Microbes hold the balance in climate crisis
Climate News Network 6/28/2019
They argue that research is ignoring the silent, unseen majority that makes up the microbial world. Lifeforms that add up to a huge proportion of living matter on the planet are being largely left out of climate calculations.
A Kentucky Power Plant's Demise Signals a Reckoning for Coal
The 1,000-megawatt coal plant on the banks of the Ohio River hadn't produced toxic ash—or electricity—since it was retired by its owner, LG&E, in 2015. But its demise, which took less than a minute, symbolized the broader decline of coal in both generating capacity and the production of electricity.
White House physicist sought aid of rightwing thinktank to challenge climate science
In the messages, part of a group of emails obtained under the Freedom of Information Act, Happer and the Heartland adviser Hal Doiron discuss Happer’s scientific arguments in a paper attempting to knock down the concept of climate emergency, as well as ideas to make the work “more useful to a wider readership”. Happer writes he had already discussed the work with another Heartland adviser, Thomas Wysmuller.
National Centre for Climate Restoration 5/2019
2030–2050: Emissions peak in 2030, and start to fall consistent with an 80 percent reduction in fossil-fuel energy intensity by 2100 compared to 2010 energy intensity. This leads to warming of 2.4°C by 2050, consistent with the Xu and Ramanathan “baseline-fast” scenario. However, another 0.6°C of warming occurs 19 — taking the total to 3°C by 2050 — due to the activation of a number of carbon-cycle feedbacks and higher levels of ice albedo and cloud feedbacks than current models assume. [It should be noted that this is far from an extreme scenario: the low-probability, high-impact warming (five percent probability) can exceed 3.5–4°C by 2050 in the Xu and Ramanathan scheme.]
While sea levels have risen 0.5 metres by 2050, the increase may be 2–3 metres by 2100, and it is understood from historical analogues that seas may eventually rise by more than 25 metres. Thirty-five percent of the global land area, and 55 percent of the global population, are subject to more than 20 days a year of lethal heat conditions, beyond the threshold of human survivability. The destabilisation of the Jet Stream has very significantly affected the intensity and geographical distribution of the Asian and West African monsoons and, together with the further slowing of the Gulf Stream, is impinging on life support systems in Europe. North America suffers from devastating weather extremes including wildfires, heatwaves, drought and inundation. The summer monsoons in China have failed, and water flows into the great rivers of Asia are severely reduced by the loss of more than one-third of the Himalayan ice sheet. Glacial loss reaches 70 percent in the Andes, and rainfall in Mexico and central America falls by half. Semi-permanent El Nino conditions prevail. Aridification emerges over more than 30 percent of the world’s land surface. Desertification is severe in southern Africa, the southern Mediterranean, west Asia, the Middle East, inland Australia and across the south-western United States.
Michael Bloomberg Launches Beyond Carbon
Bloomberg Philanthropies 6/07/2019
Beyond Carbon will work to put the U.S. on track towards a 100% clean energy economy by working with advocates around the country to build on the leadership and climate progress underway in our states, cities, and communities. Bloomberg and his foundation joined forces with the Sierra Club in 2011 to launch Beyond Coal with the goal of closing at least a third of the country’s coal plants.
Losing Earth: The Decade We Almost Stopped Climate Change
NY MAG article Climate Change efforts 1979-1989
Editor’s Note:This narrative by Nathaniel Rich is a work of history, addressing the 10-year period from 1979 to 1989: the decisive decade when humankind first came to a broad understanding of the causes and dangers of climate change. Complementing the text is a series of aerial photographs and videos, all shot over the past year by George Steinmetz. With support from the Pulitzer Center, this two-part article is based on 18 months of reporting and well over a hundred interviews. It tracks the efforts of a small group of American scientists, activists and politicians to raise the alarm and stave off catastrophe. It will come as a revelation to many readers — an agonizing revelation — to understand how thoroughly they grasped the problem and how close they came to solving it. Jake Silverstein
Humans held responsible for twists and turns of climate change since 1900
While industry and agriculture belched greenhouse gases at an increasing pace through the 20th century, global temperature followed a jagged course, surging for 3 decades starting in 1915, leveling off from the 1950s to the late 1970s, and then resuming its climb. For decades, scientists have chalked up these early swings to the planet’s internal variability—in particular, a climatic pacemaker called the Atlantic Multidecadal Oscillation (AMO), which is characterized by long-term shifts in ocean temperatures. But researchers are increasingly questioning whether the AMO played the dominant role once thought. The oceanic pacemaker seems to be fluttering.
It is now possible to explain the record’s twists and turns almost entirely without the AMO, says Karsten Haustein
Climate change impacts worse than expected, global report warns
The Guardian- Hurricane's impact on Puerto Rico 4/26/19
The impacts and costs of 2.7 degrees Fahrenheit (1.5 degrees Celsius) of global warming will be far greater than expected, according to a comprehensive assessment by the Intergovernmental Panel on Climate Change (IPCC) released Sunday in Incheon, South Korea.
National Geo Climate change impacts worse than expected, global report warns
National Geo Climate change impacts worse than expected, global report warns 10 07 2018
The impacts and costs of 2.7 degrees Fahrenheit (1.5 degrees Celsius) of global warming will be far greater than expected, according to a comprehensive assessment by the Intergovernmental Panel on Climate Change (IPCC) released Sunday in Incheon, South Korea.
Country-level social cost of carbon
Nature Climate Change- Research Country-level social cost of carbon 9/18
Here we estimate country-level contributions to the Social Cost of Carbon (SCC) using recent climate model projections, empirical climate-driven economic damage estimations and socio-economic projections. Central specifications show high global SCC values (median, US$417 per tonne of CO2 (tCO2); 66% confidence intervals, US$177–805 per tCO2) and a country-level SCC that is unequally distributed. However, the relative ranking of countries is robust to different specifications: countries that incur large fractions of the global cost consistently include India, China, Saudi Arabia and the United States.
Climate disasters cost the world $650 billion over 3 years — Americans are bearing the brunt: Morgan Stanley
CNBC Costs of Climate Change last 3 years
North America absorbed two-thirds of the global cost of climate disasters over the last three years, Morgan Stanley says.
At $415 billion, the price of the disasters is equal to 0.66 percent of North America’s GDP.
2018 takes the podium as one of the hottest years on record. Let’s look deeper.
Mashable- Warming Overview 12/20/2018
NASA's Goddard Institute for Space Studies keeps track of Earth's changing temperatures with a data bank that reaches back to the 1880s. This year will end up as the 4th-warmest year in recorded history, Gavin Schmidt, the director of the NASA program, said over email.
World 'nowhere near on track' to avoid warming beyond 1.5C target
The Guardian-No Progress on Climate Change 9/2018
A massive, immediate transformation in the way the world’s population generates energy, uses transportation and grows food will be required to limit the global temperature rise to 1.5C and the forthcoming analysis is set to lay bare how remote this possibility is.
California 4th Annual Report Climate Change
California 4th Annual Report Climate Change
Key Findings
California’s Fourth Climate Change Assessment provides information to build resilience to climate impacts, including temperature, wildfire, water, sea level rise, and governance. Here you can view a snapshot of the key findings of the Fourth Assessment. For additional information, please download the Key Findings brochure, “California's Changing Climate 2018.”
100 Corporations Responsible For 71% Of Carbon Emissions
Carbon-Majors-Report 100 companies = 71% Climate Change CleanTechnica 100 companies = 71% Climate Change
The Carbon Majors Database stores greenhouse gas (GHG) emissions data on the largest company-related sources of all time. CDP’s Carbon Majors Report 2017 is the first in an ongoing series of publications aimed at using this Database – the most comprehensive available – to highlight the role that corporations can play in driving the global energy transition.
The Impacts of Climate Change at 1.5c, 2C and Beyond
Carbon Brief Interactive difference between 1.5c and 2c
Carbon Brief has extracted data from around 70 peer-reviewed climate studies to show how global warming is projected to affect the world and its regions.
Scroll down to see how these impacts vary at different temperature levels, across a range of key metrics. Click on the icons below to skip to specific categories and regions.
